Data Fragmentation and Integration Complexity: Why CFOs Cite It as PE's #1 Operational Challenge
Why 48% of PE CFOs cite data fragmentation as their top challenge, and how it destroys value through productivity loss, reporting delays, and cash blindness.
When private equity firms acquire a portfolio company, they gain more than an operating business—they inherit a fragmented data infrastructure scattered across legacy systems, spreadsheets, disconnected databases, and unstructured emails that collectively destroy visibility and decision velocity. In a McKinsey survey of 50 portfolio company CFOs, 48% identified “data fragmentation, enterprise-resource-planning and other systems” as their greatest operational challenge—ranking it ahead of talent acquisition (20%) and strategic alignment (20%). This isn’t a peripheral technology concern. For CFOs responsible for generating the financial discipline that PE value creation depends on, data fragmentation represents an existential operational crisis.
The problem is deceptively simple to state yet extraordinarily complex to solve: financial data is trapped in silos, spreadsheets consume 9+ hours per week per finance team member managing manual data entry, reporting lags days or weeks behind operational reality, and decision-making happens on stale information. Knowledge workers across investment firms report spending 12 hours per week manually gathering data from disconnected systems—a productivity drain equivalent to one full day per week devoted to finding information rather than analyzing it. For PE firms managing dozens or hundreds of portfolio companies, this fragmentation compounds into a “fog of war” that prevents the real-time visibility required for rapid value creation and cash management.
The stakes extend far beyond operational convenience. Data fragmentation directly impairs the fundamental capabilities that PE firms depend on: accurate financial reporting, predictive cash flow forecasting, real-time KPI tracking for investment decision-making, and the rapid integration of newly acquired companies into standardized operating systems. When data is fragmented, PE firms systematically make decisions based on incomplete or outdated information. When integration happens slowly, margin expansion targets become unattainable. When spreadsheets proliferate, hidden errors accumulate until they trigger $100M+ financial misstatements that damage LP confidence.
For Operating Partners, CFOs, and investment professionals responsible for portfolio performance, understanding why data fragmentation emerges, how it destroys value, and what integration solutions actually work has become essential to competitive performance.
Why Data Fragmentation Emerges: The Root Cause of PE Portfolio Chaos
Data fragmentation doesn’t emerge from a single failure—it’s the inevitable byproduct of how PE-backed companies evolve. Understanding its origins illuminates why it’s so difficult to resolve.
The Acquisition Inheritance Problem
When a PE firm acquires a target company, it inherits the entire technological legacy of the business. If the company has operated independently for decades, its finance function likely runs on systems optimized for that company’s historical needs, not for PE reporting requirements.
A typical acquisition scenario: Company A operates with a 1990s-era ERP system connected to three separate legacy accounting systems, a standalone CRM that doesn’t integrate with anything, spreadsheet-based revenue recognition managed by the finance controller, manual inventory tracking that connects to neither ERP nor accounting systems, and customer data scattered across email, Salesforce, and disconnected regional systems. The company’s CFO knows the gaps—they’ve accepted them as operational reality.
When PE acquires Company A, the new mandate is incompatible with this fragmented architecture. PE investors demand daily cash reporting (the company previously reported weekly). They require standardized monthly financial packages (the company previously reported quarterly). They need real-time KPI dashboards (the company manually compiled reports in spreadsheets). They want integrated financial and operational data to identify margin expansion opportunities (the company’s systems couldn’t produce this analysis even on request).
Yet migrating from the inherited system to an integrated architecture isn’t a software deployment—it’s an organizational transformation that requires changing how finance, operations, and IT coordinate; how data flows across functions; how people work; and how systems communicate. For a company with 500 employees, a meaningful system overhaul typically requires 12-24 months and $2-5M in capital and consulting investment. When PE holds investments for 5-7 years, this timeline competes with the operating plan priorities that drive near-term value creation.
The Multi-Company Portfolio Problem
For PE firms with multiple portfolio companies, fragmentation scales exponentially. If Company A has integrated systems and Company B has fragmented legacy systems, the holding company cannot produce a consolidated portfolio view without massive manual reconciliation. Each company reports on different accounting close calendars, uses different chart-of-account structures, defines KPIs differently, and stores data in different systems.
This creates a cruel arithmetic problem. If a PE firm has 12 portfolio companies, each reporting to different standards, the portfolio office must either:
- Accept 12 different reporting formats and spend enormous effort reconciling them, or
- Impose standardized reporting requirements and consume massive implementation bandwidth across the portfolio, or
- Maintain inconsistent visibility and accept decision-making on incomplete data.
Most PE firms attempt some combination of all three, resulting in constant compromise. The portfolio company that should be focused on executing its operating plan instead spends weeks preparing month-end reports in the format demanded by the holding company. The portfolio office should be analyzing performance instead spends weeks reconciling inconsistent KPI definitions.
The result: both the portfolio company and the portfolio office operate sub-optimally, and neither has time for the strategic work that creates value.
The Spreadsheet Dependency Spiral
At the intersection of these challenges, spreadsheets proliferate. When Company A’s ERP can’t produce the reporting format PE demands, finance creates a spreadsheet. When Company B’s accounting system defines cost of goods sold differently, finance creates a reconciliation spreadsheet. When the portfolio office needs a consolidated cash position and companies report on different schedules, finance creates a master consolidation spreadsheet.
Each spreadsheet solves an immediate problem but creates a new fragmentation point. Spreadsheets aren’t auditable systems—they have no access controls, no change history, no data lineage, and no validation. A formula error in a spreadsheet used for executive reporting goes undetected until it creates a major misstatement. Research into operational spreadsheets finds that 0.8-1.8% of formula cells contain errors, and in large spreadsheet models, approximately 50% contain at least one “material defect.”
For PE firms managing hundreds of millions in capital allocation decisions, spreadsheet errors are not theoretical risks—they’re recurring operational disasters. JPMorgan Chase’s “London Whale” incident in 2012 involved a $2.6 billion loss traceable partially to spreadsheet formula errors in risk models across multiple sheets—formulas that divided by the sum instead of the average of rate changes. Goldman Sachs’ $100 million Tibco Software sale error involved double-counting shares in a spreadsheet used to calculate equity value. Fidelity’s 1994 Magellan fund distribution error ($2.6 billion miscalculation) originated in a spreadsheet where an accountant omitted a minus sign on a capital loss, transforming a loss into a gain.
These aren’t rogue incidents—they reflect systematic reliance on a tool (spreadsheets) that is fundamentally unsuited for business-critical financial processes. Yet spreadsheet dependency persists because the alternative—investing in proper system integration—requires capital, time, and organizational change.
The Value Destruction Cascade: How Data Fragmentation Erodes PE Returns
The impact of data fragmentation on PE value creation occurs through multiple mechanisms that compound over the hold period.
Productivity Loss: The 12-Hour-Per-Week Drain
The most quantifiable impact: finance team members waste enormous amounts of productive time searching for information and manually managing data across disconnected systems.
Knowledge workers at investment firms report spending 12 hours per week (approximately 30% of a full-time week) manually gathering data from disparate systems. For a 10-person finance team, this represents 3.75 FTE annually devoted to finding data rather than analyzing it or creating value.
Finance teams spending time on manual data gathering are doing the following non-productive work:
- Data extraction: Manually pulling reports from one system, another system, and a spreadsheet because the systems don’t talk to each other
- Reconciliation: Comparing numbers across systems to find discrepancies (often discovering that the same KPI is calculated differently in different systems)
- Manual entry: Re-entering data from one system into another because no automated integration exists
- Format conversion: Transforming data from System A’s output format into System B’s input format
- Version control: Managing multiple versions of spreadsheets, determining which is most recent, and reconciling conflicts when two team members update the same sheet
This is pure waste. It generates zero analytical insight, creates zero business value, and represents pure resource drain.
On an annualized basis, each finance team member’s time on manual data management costs approximately $28,500 in productivity loss (assuming a $60,000 average salary at 30% productivity loss rate). For a 10-person team, this totals $285,000 annually. Over a 5-year PE hold period, this represents $1.425M in cumulative productivity loss for a single portfolio company.
This calculation doesn’t account for the fact that spreadsheet-dependent workflows introduce errors that require correction time, create delays in reporting that compress the time available for analysis, and force reactive firefighting when the inevitable spreadsheet error causes a significant misstatement.
Reporting Delays and Decision Lags: The Stale Data Problem
In a typical PE-backed company without integrated systems, financial reporting follows a painful timeline:
- Day 1-15 of month: Companies close their general ledger and subsidiary systems
- Day 15-20: Finance manually reconciles subsidiary data into a consolidated general ledger, often discovering discrepancies that require investigation and adjustment
- Day 20-25: Controllers and accountants work backwards through reconciliation errors to identify which system reported incorrectly
- Day 25-30: Finance prepares month-end reporting package, often manually compiling data from multiple sources into a standardized format
- Day 30+: Portfolio company reports to holding company; holding company receives data; investment committee meets
By the time portfolio company data reaches the investment committee, it describes operations 30-40 days in the past. For rapidly moving businesses or those facing cash flow pressures, 30-day-old data is nearly useless for decision-making.
This lag compounds when responding to ad hoc queries. If an Operating Partner asks “What was our cash position yesterday?” or “Did we hit the cash flow target this week?”, the answer requires:
- Manual inquiry to multiple systems
- Data extraction and aggregation
- Variance analysis to determine root causes
- Several hours to several days for the analysis
Real-time decision-making becomes impossible. Strategic questions that depend on current data—“Should we increase inventory this month?” “Can we fund the acquisition of Company X with cash from portfolio operations?” “Do we need to draw on the credit facility this quarter?”—cannot be answered with 30-day-old data.
Cash Management Blindness: The Highest-Impact Fragmentation
Data fragmentation’s most financially impactful consequence manifests in cash management.
PE firms managing portfolios require consolidated daily cash visibility to:
- Optimize working capital: Identify cash locked in receivables or inventory that can be deployed elsewhere
- Manage liquidity: Ensure the portfolio maintains sufficient cash buffers while deploying excess capital efficiently
- Coordinate borrowing: Decide whether to draw on credit facilities, refinance debt, or distribute capital based on accurate cash position
- Execute strategic actions: Fund acquisitions, refinance debt, or declare dividends based on accurate cash availability
When cash data is fragmented across dozens of portfolio companies, each reporting on different schedules using different systems and definitions, consolidated cash position visibility becomes impossible. One recent industry analysis identified that PE-backed firms commonly experience:
- Forecast variances exceeding two weeks’ worth of cash due to manual processes and system delays
- Unpredictable cash flows from seasonal business cycles complicated by the inability to forecast accurately with fragmented data
- Delayed detection of cash shortages because cash position consolidation happens 5-10 days after month-end
- Locked working capital in receivables and inventory because fragmented data doesn’t enable real-time visibility of what cash is actually available versus committed
For a portfolio company with $100M in annual revenue and typical 15% net margins, a two-week cash forecast variance represents $5.77M in potential cash position error. For a PE firm managing a $500M portfolio, a two-week variance across companies might represent $30-50M in aggregated forecast error.
These forecast errors force PE firms into suboptimal capital allocation: maintaining larger cash reserves than necessary to protect against forecast error, deferring growth investments pending better visibility, or accelerating distributions prematurely based on optimistic cash forecasts that later prove wrong.
A recent study found that approximately 35% of LPs now regard advanced digital analytics—including real-time cash insights—as critical in evaluating manager performance. PE firms that fail to develop robust real-time cash visibility are at a competitive disadvantage in LP evaluations, and their portfolio companies operate with unnecessary financial inefficiency.
Decision-Making Delays: The Value Creation Tax
When data is fragmented, decision-making velocity collapses. Strategic decisions that should require 2-3 days of analysis instead require 2-3 weeks because the underlying data doesn’t exist in the format needed for analysis.
Consider a typical portfolio company opportunity: the CFO identifies potential for margin improvement through consolidating redundant vendor contracts. The analysis requires:
- Sales data by vendor across all regions (stored in one system)
- Historical pricing by vendor (stored in a different system)
- Current contract terms (stored in emails and spreadsheets)
- Competitive bidding analysis (stored in a third system if at all)
- Detailed margin impact by product line (stored in the accounting system)
If all this data were integrated into a single repository, the analysis might take 2-3 days. With fragmented data, finance spends 10-15 days extracting, reconciling, and validating data before even beginning the actual analysis. The opportunity that should have been executed within 30 days is still being discussed 60 days later—and by then, other priorities have displaced it from the executive team’s attention.
This pattern repeats across hundreds of potential value creation initiatives. The cumulative effect: initiatives don’t get executed because data fragmentation makes them feel time-prohibitive relative to other work. A $2-3M margin improvement initiative never gets prioritized because the up-front data work feels overwhelming.
Integration Failure: The Catastrophic Fragmentation Scenario
When PE firms acquire multiple companies with the goal of consolidating them into a single operating entity, data fragmentation becomes an integration crisis.
A typical scenario: PE firm acquires Company A and Company B in a bolt-on acquisition strategy, with the goal of consolidating them into a unified operating platform. Company A has integrated systems optimized for its business model. Company B has completely separate systems optimized for its business model. The integration plan calls for consolidating both companies into a single operating model by Month 9.
What actually happens: Finance discovers in Month 2 that the two companies’ chart-of-account structures are completely different, making consolidated financial reporting nearly impossible without massive data transformation. In Month 4, Operations discovers that Company A’s inventory is tracked in System X while Company B’s inventory is tracked in a different System Y, and the two systems use different unit-of-measure definitions. In Month 6, after months of attempting to integrate data, the integration team realizes that some of Company B’s customer data is unavailable in retrievable format—it exists only in the original contact’s personal customer relationship management system.
By Month 9, the timeline is blown. The consolidated operations plan is pushed to Month 15. Finance has consumed 50% of its capacity managing integration data problems rather than driving value creation in the consolidated entity. The $50M cost savings targeted from integration are delayed 6 months, pushing the projected return on the acquisition out by 6-12 months.
For a PE firm targeting 3-4x returns over 5-7 years, a 6-month integration delay reducing the value creation window from 36 to 30 months can reduce realized MOIC by 5-10% in net present value terms.
Spreadsheets: The Financial Weapon of Mass Distraction
To understand the full financial impact of data fragmentation, one must understand spreadsheets’ outsized role in PE firm operations. Spreadsheets aren’t merely a symptom of data fragmentation—they’re a mechanism that amplifies it.
The Ubiquity of Spreadsheet Risk
Spreadsheets have been called “the world’s most important financial application” because nearly every PE firm, investment bank, and treasury function still relies on them for critical financial processes. Yet research into spreadsheet reliability is deeply alarming.
A comprehensive study of operational spreadsheets found that:
- Approximately 90% of spreadsheets contain at least one error
- Approximately 50% of spreadsheet models used in large businesses contain “material defects”—errors substantial enough to impact financial decisions
- In complex spreadsheet models, 0.8-1.8% of formula cells contain errors—meaning a 5,000-cell spreadsheet contains on average 40-90 formula errors
For PE firms using spreadsheets for critical functions—portfolio valuations, capital account allocations, performance calculations, investment recommendations—these error rates translate to systematic financial risk.
The Spreadsheet Error Hall of Shame
The financial services industry’s spreadsheet errors have achieved almost legendary status:
- Fidelity Magellan Fund (1994): A spreadsheet error caused Fidelity to miscalculate a fund distribution by $2.6 billion. An accountant had omitted a minus sign on a $1.3 billion capital loss, converting it into a gain. The fund’s president had to publicly explain the error to shareholders.
- Fannie Mae (2003): A quarterly earnings report contained a formula error that understated stockholders’ equity by $1.1 billion. An accountant had used an incorrect formula in an Excel spreadsheet to compute changes in the value of commitments to purchase mortgages. The stock fell 6% and the company faced congressional scrutiny.
- Westpac Bank (2005): The bank accidentally announced record profits before they were officially released, distributing the information to 37 analysts through an Excel template. An employee had attempted to hide text by formatting it in black font on a black background, but the “hidden” numbers were easily visible through minor spreadsheet manipulation.
- Goldman Sachs—Tibco Software Sale (2014): Goldman Sachs calculated Tibco’s equity value as $4.2 billion using a spreadsheet that double-counted shares. The error was only discovered later through SEC-level scrutiny. Goldman later settled litigation for $30 million.
- JPMorgan Chase—“London Whale” (2012): Trader Bruno Iksil accumulated massive losses through derivatives trading, partially enabled by spreadsheet formula errors in value-at-risk (VaR) models across multiple sheets. One critical formula divided by the sum instead of the average of rate changes, producing incorrect risk calculations. The total loss: $6.2 billion, with the initial $2.6 billion in losses traced to the spreadsheet formula error.
- Tesla—SolarCity Acquisition (2016): Tesla’s acquisition analysis used a Lazard spreadsheet that double-counted SolarCity’s projected indebtedness in the equity valuation model, overstating equity value by billions. The error was only discovered later through SEC-level scrutiny.
These aren’t isolated incidents among unsophisticated users. These are institutions with substantial financial controls, dedicated finance teams, and risk management infrastructure. Yet spreadsheet errors persist because spreadsheets lack:
- Version control: Different people working on the same spreadsheet can create conflicting versions; there’s no built-in mechanism to track who changed what
- Formula validation: A spreadsheet doesn’t flag formula errors or inconsistencies; an incorrect formula looks identical to a correct formula
- Access controls: Any person with access to the file can modify any cell without audit trail
- Dependency tracking: When one spreadsheet references another, changes in the source spreadsheet may break calculations in dependent spreadsheets without warning
- Testing protocols: Spreadsheets are modified in production environments without the change control or testing protocols that software systems require
The Hidden Spreadsheet Costs
Beyond catastrophic errors, spreadsheets impose enormous operational costs:
- Audit and review time: Since spreadsheet formulas lack built-in validation, they must be manually reviewed for errors. Organizations conducting periodic spreadsheet audits spend $5,000-$50,000 per audit per critical spreadsheet. A PE firm with 200 critical spreadsheets might spend $1M+ annually on spreadsheet audits.
- Maintenance and update burden: When business logic changes (new accounting rule, revised calculation methodology), all dependent spreadsheets must be manually updated. This creates coordination challenges and risk of inconsistency across the portfolio.
- Data quality management: Spreadsheets are prone to accidental deletion, formula overwrite, and inconsistency. Finance teams spend significant time validating that the right data is in each cell.
- Compliance and audit support: When auditors review critical financial processes and discover reliance on spreadsheets, they often increase audit scope, require more detailed documentation, and may issue management letter comments about control weaknesses. PE firms’ LP reporting increasingly requires assurances that critical financial data doesn’t depend on uncontrolled spreadsheets.
The Financial Quantification: Measuring Fragmentation’s Value Destruction
For PE decision-makers evaluating whether to invest in data integration, the financial case requires quantification of fragmentation’s cost.
The All-In Cost of Data Fragmentation
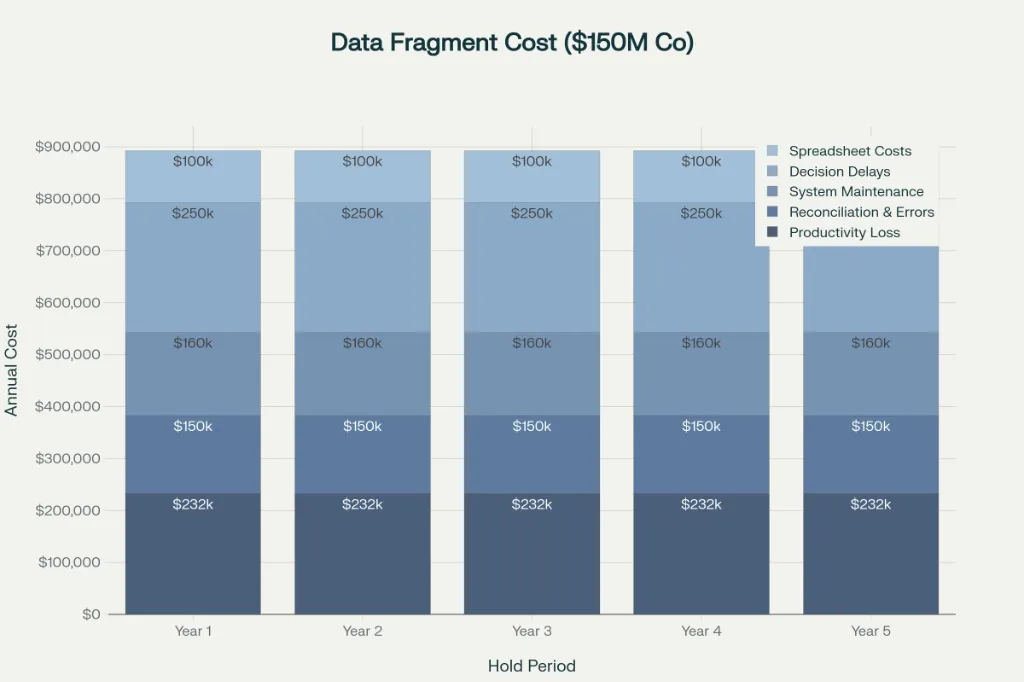
For a typical mid-market portfolio company ($100-300M revenue), annual costs of data fragmentation include:
Direct productivity loss:
- Finance team: 10 people × $60,000 salary × 30% lost to manual data work = $180,000
- Operations team contributing to data management: 5 people × $70,000 × 15% = $52,500
- Annual total: $232,500
Reconciliation and error correction:
- Monthly reconciliation work: 2 FTE × $70,000 = $140,000
- Error investigation and correction: estimated 100 hours annually × $100/hour = $10,000
- Annual total: $150,000
Decision delay costs:
- Delayed decisions resulting in missed value creation opportunities: estimated $100,000-$500,000 annually (conservative estimate of opportunities delayed or abandoned due to data unavailability)
Spreadsheet audit and maintenance:
- Annual spreadsheet audits and maintenance: estimated $50,000-$150,000
System maintenance and workarounds:
- IT time managing legacy system interfaces, spreadsheet uploads, and data extraction: 2 FTE × $80,000 = $160,000
Total annual cost of data fragmentation: approximately $600,000-$1.1M
Over a 5-year PE hold period, cumulative cost of fragmentation: $3-5.5M
For many portfolio companies, this exceeds the all-in cost of proper data integration ($2-5M).
The Cost-Benefit of Integration Solutions
Implementing integrated data systems requires investment but delivers substantial payback:
Typical data integration project costs:
- Software licensing (ERP, data integration platforms): $50,000-$150,000 upfront + $30,000-$60,000 annually
- Implementation consulting and professional services: $200,000-$800,000 (depending on complexity)
- Data migration and cleanup: $100,000-$400,000
- Staff training: $50,000-$150,000
- Total implementation cost: $400,000-$1.5M over 12-18 months
Annual benefits after implementation:
- Productivity recovery (30% of 15 FTE back from manual data work): $350,000
- Reduced error correction and reconciliation: $150,000
- Faster decision-making enabling captured opportunities: $200,000-$500,000
- Reduced spreadsheet audit and maintenance: $75,000
- Total annual benefits: $775,000-$1.075M
Payback period: 9-18 months (depending on implementation speed and realization of all benefits)
5-year value creation from integration: Approximately $2.5-3.5M in incremental value
From a pure financial perspective, for most portfolio companies, data integration is a high-return investment. Yet it remains underutilized because it competes with other near-term operational priorities for capital and management attention.
Integration Complexity: Why Data Consolidation Consumes Enormous Capital
While the financial case for integration is strong, the implementation reality is complex. Understanding this complexity illuminates why so many portfolio companies remain fragmented.
Integration Complexity Drivers
Several factors create substantial integration implementation burden:
- Incompatible data models: Companies acquired from different industries or geographies often use completely different definitions for the same concept. “Revenue” might be calculated at invoice time in one company and at cash receipt in another. “Cost of goods sold” might include or exclude freight, overhead allocation, and inventory reserve changes. “Customer” might be defined by legal entity, operating location, billing address, or supply chain role. Unifying these definitions requires business process redesign before technical integration can occur.
- Legacy system dependencies: Some portfolio companies operate on systems where the vendor no longer provides support, documentation is sparse or lost, data extraction is difficult, and the original developers are unavailable. Moving data from these systems requires custom extraction logic that’s expensive to build and fragile to maintain.
- Scale and complexity: A portfolio company with 10 operating locations might have 10 separate regional systems, each with its own data repository, user community, and workflows. Consolidating them into a single system means choosing winners and losers—certain regions will lose system features they’ve become dependent on, creating organizational resistance.
- Staffing and expertise: Building integrated systems requires specific expertise (data engineering, system architecture, database administration) that may not exist internally. Bringing in external consultants adds 30-50% to project costs.
- Organizational disruption: System implementations force organizational change. Finance team members accustomed to working in System A must learn System B. Controllers lose the customizations they’ve built over years. Operating groups lose the flexibility of independent systems. This organizational disruption creates resistance that extends implementation timelines.
The Hidden Timeline Risk
Data integration projects routinely exceed planned timelines by 25-50%. A project planned for 12 months often takes 16-18 months. This delay has financial consequences:
- Benefits realization is pushed back 4-6 months, extending payback period
- Competing priorities may consume the attention of finance and operations leaders, reducing integration project priority
- Staff turnover during extended projects reduces institutional knowledge
- Scope creep expands as new requirements emerge during implementation
A common pattern: Data integration projects planned for 12 months, extended to 18 months, then abandoned partially complete, resulting in worse fragmentation than pre-project (systems partially integrated but data inconsistencies proliferate).
The Framework: How to Assess and Address Data Fragmentation
For PE firms and portfolio company CFOs evaluating data fragmentation challenges, a structured assessment framework helps prioritize and stage integration efforts.
Phase 1: Diagnostic Assessment (Weeks 1-4)
Before investing in integration, conduct a baseline assessment:
Map current data flows:
- Document where financial data originates (systems, spreadsheets, manual entry)
- Document where data is transformed (consolidation spreadsheets, manual adjustments)
- Document where data is consumed (reporting, decision-making, analytics)
- Identify data redundancy (same data existing in multiple systems with different values)
Quantify current costs:
- Time spent on manual data management (interview finance team; assess actual time allocation)
- Frequency and cost of data errors
- System maintenance costs
- Spreadsheet audit and maintenance costs
Identify critical gaps:
- What data is unavailable when needed (e.g., real-time cash position)?
- What decisions are constrained by data fragmentation (e.g., inability to optimize working capital)?
- What integrations would have highest impact on value creation?
Output: Baseline cost of fragmentation; prioritized list of integration opportunities
Phase 2: Business Case Development (Weeks 4-8)
For highest-priority integration opportunities:
Define target state:
- What data would be available in the integrated system?
- What reporting and analytics would be enabled?
- What operational processes would change?
Develop integration roadmap:
- Sequence of system implementations (often staged across multiple portfolio companies)
- Timeline and resource requirements
- Technology platform selection
Quantify benefits:
- Productivity recovery from reduced manual data management
- Operational benefit from improved visibility (e.g., improved working capital management, reduced cash forecast error)
- Decision-making benefit from faster insights
- Risk reduction from eliminated spreadsheet dependencies
Calculate ROI:
- Implementation costs vs. 3-5 year benefits
- Payback period
Output: Prioritized integration roadmap with ROI case for executive approval
Phase 3: Implementation Planning (Weeks 8-16)
For approved integration initiatives:
Design system architecture:
- Select platform(s) (ERP, cloud accounting, data integration platform)
- Design data model and integration flows
- Plan data migration
Establish governance:
- Assign executive sponsor
- Establish project governance structure
- Define decision-making authority
Resource planning:
- Secure executive and finance leadership commitment
- Assign internal project team leads
- Select implementation partner (if external resources required)
Change management:
- Develop training and communication strategy
- Identify likely resistance points; develop mitigation plans
- Plan for organizational change during and after implementation
Output: Detailed implementation plan with timeline, resource requirements, and governance structure
Phase 4: Ongoing Monitoring (Post-Implementation)
After implementation:
Track benefit realization:
- Measure actual vs. projected productivity improvements
- Monitor error rates and spreadsheet dependency reduction
- Assess decision-making speed improvements
Manage technical debt:
- Monitor system performance and data quality
- Identify and prioritize enhancements
- Plan for system upgrades and technology refreshes
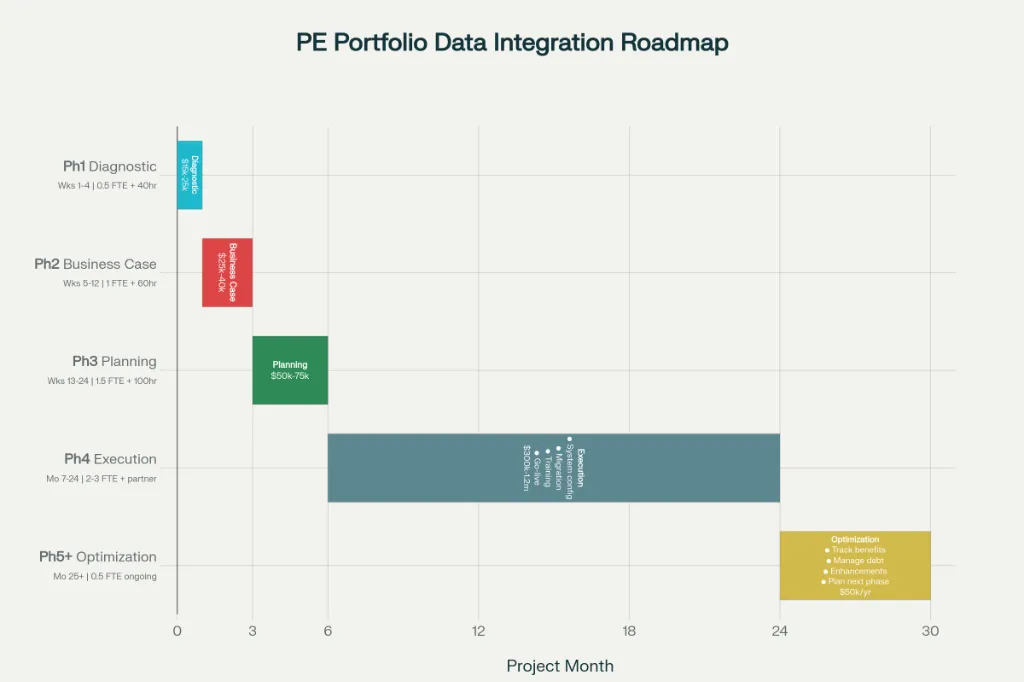
Actionable Recommendations for PE Firms and Portfolio Companies
Based on current research and implementation experience, PE firms should:
1. Establish Data Integration as a Strategic Priority in First 100 Days Post-Acquisition
Data fragmentation issues typically aren’t visible during due diligence. By the time they emerge (during integration planning), months have passed. Establish assessment of data architecture as a mandatory part of the first 100 days post-close:
- Diagnostic assessment of data fragmentation
- Quantification of fragmentation costs
- High-level roadmap for integration staged across the hold period
This early assessment enables integration planning to be integrated into the operating plan rather than bolted on later.
2. Allocate Capital for Integration in the Acquisition Model
Rather than treating data integration as a discretionary project to be funded from operating savings, allocate specific capital budget for integration in the acquisition model:
- Small/mid-market acquisitions: $250K-$750K integration budget
- Larger acquisitions: $1M-$3M integration budget
- Bolt-on acquisitions with consolidation: additional $500K-$2M for system consolidation
This ensures integration doesn’t get starved of resources by competing operational priorities.
3. Prioritize Spreadsheet Elimination Over System Perfection
Rather than attempting to build perfect integrated systems immediately, prioritize eliminating dependency on spreadsheets for critical financial processes:
- Map critical spreadsheets (those used for financial reporting, cash management, KPI tracking)
- Establish ownership and governance for each critical spreadsheet
- Develop business cases for moving critical spreadsheet processes into system-based processes
- Implement spreadsheet audits for those remaining spreadsheets
A realistic roadmap: Eliminate 80% of spreadsheet dependency within 12-18 months, with remaining 20% reserved for true ad hoc analysis.
4. Implement Real-Time Cash Visibility as First Integration Priority
Rather than attempting to integrate all systems simultaneously, prioritize cash visibility:
- Consolidate daily cash position from all portfolio companies into a single dashboard
- Implement cash forecasting that incorporates data from operational systems
- Enable real-time monitoring of cash variance vs. forecast
Cash visibility delivers immediate financial value (improved working capital management, optimized liquidity management) and builds momentum for broader integration initiatives.
5. Establish Data Governance Standards Across Portfolio
Rather than allowing each portfolio company to operate independently:
- Establish portfolio-wide data standards for financial definitions, accounting policies, and KPI calculations
- Require all portfolio companies to report against standardized dimensions
- Create data dictionaries that define terms and calculations across the portfolio
These standards enable comparison across the portfolio, faster consolidation, and easier integration when executing bolt-on acquisitions.
6. Invest in Data Integration Platform (Not Just ERP)
Modern data integration is rarely a single-system problem. Few companies can migrate entirely to a new ERP. Instead, adopt a “hub and spoke” architecture:
- Retain business-critical legacy systems but implement data integration layer between them
- Use cloud-based data integration platforms (iPaaS solutions like MuleSoft, Workato, or similar) to normalize data across systems
- Build analytics layer on top of integrated data
This approach enables faster integration without requiring multi-year system replacement projects.
Conclusion: Data Fragmentation as a Value Creation Lever
The 48% of PE-backed CFOs citing data fragmentation as their top operational challenge reflect a well-founded concern. Data fragmentation directly impairs cash management, extends decision-making timelines, generates spreadsheet errors with massive financial consequences, and consumes enormous productivity.
Yet data fragmentation is not inevitable. PE firms that systematically address fragmentation—through diagnostic assessment, capital allocation, phased integration, and governance standards—transform data from a liability into a competitive advantage.
For portfolio companies with integrated systems, accessible data, and reliable reporting, value creation accelerates. Cash can be optimized. Decisions can be made rapidly on current information. Spreadsheet errors are eliminated. Integration becomes possible rather than chaotic.
The firms that will dominate PE returns in the next 5 years are those that have made data integration a strategic priority and allocated appropriate capital and talent to execute it. For Operating Partners, CFOs, and investment professionals responsible for portfolio performance, treating data fragmentation not as a technology problem but as a value creation imperative is essential to competitive performance.
References and Source Data
- McKinsey survey of 50 portfolio company CFOs; 48% cited “data fragmentation, enterprise-resource-planning and other systems” as top challenge (2021, cited in PrivateEquityCXO.com and IQEQ)
- Forrester Consulting research cited in Empaxis report: 79% of knowledge workers report teams are siloed, with 12 hours per week spent manually gathering data (2024-2025)
- Future Processing analysis of data integration project costs; typical upfront costs for enterprise systems integration $400K-$1.5M; timelines 12-18 months (2025)
- Operational spreadsheet research: 0.8-1.8% of formula cells contain errors; approximately 50% of spreadsheet models in large businesses contain material defects (academic research compiled by multiple studies)
- JPMorgan Chase VaR model errors in “London Whale” trading loss; spreadsheet formula divided by sum instead of average; contribution to $6.2 billion loss traced partially to spreadsheet errors (JPMorgan Chase report, 2012)
- Goldman Sachs—Tibco Software Sale; spreadsheet error double-counted shares; $100 million valuation error; settlement $30 million (2014, SEC filings, Wall Street Journal)
- Multiple case studies: Fidelity Magellan ($2.6B distribution error, 1994); Fannie Mae ($1.1B equity understatement, 2003); Westpac (early profit announcement, 2005); Tesla SolarCity (acquisition valuation error, 2016); additional research from “Worst Financial Services Excel Errors” compilation (QashQade, 2023)
- Parseur research on manual data entry costs: $28,500 per employee annually; 9+ hours weekly on manual data entry in finance teams (2025)
- Cash visibility analysis from Acquisition International and Salfi Group: PE-backed firms experience 2+ week forecast variances, delayed cash shortage detection, locked working capital from poor visibility (2025)
- Adams Street Partners 2025 Global Investor Survey: 35% of LPs regard advanced digital analytics including real-time cash insights as critical in manager evaluation (2025)
- Additional sources: Consero 2024 CFO Survey; RAISE Operational Excellence in Fund Operations (2025); PwC Private Equity Trend Report 2025; Allvue Systems whitepaper on spreadsheet risk in private capital; SIA Partners publication on data silos in private capital; Sage Intacct/CBH analysis of data silo costs