Cloud Infrastructure Fragmentation and Cost Overruns: The 50% Cost of Revenue Margin Eraser PE Firms Systematically Underestimate
Why cloud costs consume 50% of cost of revenue for SaaS companies, and how to capture this 20-50% margin improvement opportunity.
When a PE firm acquires a SaaS business or cloud-native company, it often inherits a deceptively complex problem hidden beneath what appeared to be a clean technology infrastructure during diligence: cloud cost fragmentation, hidden egress fees, multi-cloud sprawl, and architectural inefficiencies that transform what should be a variable cost advantage into a margin-crushing expense that grows with the business rather than shrinking.
The scale of this problem is extraordinary and largely invisible to traditional financial analysis: public cloud costs for SaaS companies can reach 50% or more of total cost of revenue—not as an outlier, but as a systematic reality. For a SaaS company with $50M in annual revenue and 60% gross margins ($30M), cloud infrastructure costs consuming 50% of cost of revenue means $15M annually spent on cloud—effectively reducing true gross margins from 60% to 40%. In an industry where SaaS multiples are directly driven by gross margin (typically 7-10x for 60% margins vs. 4-6x for 40% margins), this represents a 40-50% valuation compression, equivalent to $100M+ in enterprise value destruction on a $250M-$500M SaaS acquisition.
Yet most PE firms fail to identify or quantify cloud cost fragmentation during acquisition diligence. Standard technology due diligence reviews cloud architecture but typically stops at identifying “architecture is AWS-based” without assessing cost efficiency, hidden charges, over-provisioning, or multi-cloud sprawl. Only when companies are integrated post-close do finance teams discover the true economics: cloud bills growing 20-40% annually despite flat customer growth, hidden egress fees representing 15-25% of cloud spending, over-provisioning consuming 40-60% of purchased compute capacity, and multi-cloud fragmentation creating duplicate costs across platforms.
Dropbox provides the clearest proof point: the company spent 10+ years optimizing cloud operations before finally shifting 90% of data out of AWS to proprietary infrastructure, saving $74.6 million over two years while increasing gross margins from 33% to 67%. For PE firms acquiring SaaS companies trapped in similar cloud cost structures, this represents the single largest hidden margin improvement opportunity: 20-50% reductions in infrastructure spending through cloud optimization or repatriation—value creation that flows directly to EBITDA and exit multiples.
This article deconstructs cloud infrastructure fragmentation and cost overruns in PE acquisitions: why cloud costs accumulate inefficiently, what specific architectural patterns create the highest waste, how hidden egress fees and over-provisioning erode margins, how cloud repatriation creates sustainable competitive advantages, and how to structure deals and post-close operations to transform cloud infrastructure from a value destroyer into a value creation lever.
The Cloud Economics Paradox: Why Costs Grow With the Business
Cloud computing was supposed to deliver scalable, variable cost infrastructure with minimal upfront investment. For SaaS businesses in their early stages, this promise is real. But as SaaS companies mature and customer bases scale, the underlying cloud economics that drive costs become increasingly misaligned with business growth and unit economics.
Why Cloud Costs Don’t Scale Efficiently With Revenue
Unlike software licensing (where incremental customers require no additional infrastructure cost) or professional services (where incremental revenue requires proportional additional labor costs), SaaS cloud costs scale non-linearly with revenue and customer growth for three reasons:
Reason 1: Usage-Based Pricing Penalizes Scale
Cloud providers charge based on data transferred (egress fees), compute consumed, storage used, and database queries executed. As a SaaS company grows, each incremental customer generates incremental cloud costs. For a company growing from $10M to $50M in annual recurring revenue, cloud infrastructure costs might grow from $2M to $12M—a 6x increase in costs on a 5x increase in revenue. The company’s cost of revenue increases, margins compress, and exit valuation potential decreases.
By contrast, traditional software companies with on-premises infrastructure experiences declining infrastructure costs per unit of revenue as customer base scales (fixed infrastructure costs amortized across larger revenue base). SaaS companies with cloud infrastructure experience the opposite: infrastructure costs scale faster than revenue, creating a ceiling on achievable gross margins.
Reason 2: Over-Provisioning to Prevent Performance Issues
SaaS companies must maintain sufficient cloud capacity to handle peak customer activity without performance degradation. But most teams over-provision for “just in case” scenarios, resulting in 40-60% of purchased compute sitting idle at any given time. A company sizing for 100% peak concurrent usage when actual peak is 60% of provisioned capacity is paying for infrastructure 40% of the time that provides no value.
Additionally, engineering teams often prioritize performance and availability over cost, designing architectures that maximize reliability but consume 2-3x more compute than necessary. Reserved instance programs designed to reduce cloud costs often go underutilized because teams don’t understand their own usage patterns and purchase conservatively.
Reason 3: Hidden Costs and Egress Fees
Cloud providers’ pricing models include numerous hidden costs that accumulate over time:
- Egress fees: $0.09-$0.12 per GB for data transferred out of cloud (standard rates across AWS, Azure, Google Cloud). For a SaaS company transferring 1 PB of data monthly (typical for video platforms, data analytics, etc.), this represents $10,000-$13,000 monthly in egress fees—$120K-$156K annually—that was never visible during architecture and budgeting phases.
- Data retrieval costs: $0.01-$0.03 per GB for accessing data stored in cold storage tiers. These costs are often completely invisible until bills arrive.
- Cross-region data transfer: Fees for moving data between availability zones or regions (separate from public internet egress). Companies operating multi-region for disaster recovery often don’t realize cross-region replication incurs additional charges.
- API call charges: Some cloud services charge per API call. Companies making millions of API calls to services like DynamoDB, CloudWatch, or Lambda can accumulate surprising charges that scale with customer growth.
- License transfer costs: Running Windows or SQL Server on AWS incurs licensing charges ($0.50-$0.60+ per hour for Windows licensing alone) that can double or triple compute instance costs.
For a typical SaaS company, these hidden costs represent 15-25% of total cloud spending—$300K-$600K annually for a company with $2M annual cloud bills.
Multi-Cloud Fragmentation: The Architecture That Erodes Margins
Many SaaS companies operate across multiple cloud providers (AWS + Azure, AWS + Google Cloud, etc.) for redundancy, to avoid vendor lock-in, or because different workloads are optimized for different providers. This multi-cloud approach creates architectural complexity and cost fragmentation:
- No coordinated optimization: Each cloud requires its own optimization tooling, monitoring, and governance. AWS Cost Explorer works for AWS; Azure Cost Management works for Azure. Most organizations don’t implement cross-cloud optimization, missing opportunities for arbitrage and consolidation.
- Duplicate capabilities: Applications are deployed redundantly across clouds for high availability. A SaaS company might run primary workloads in AWS + backup in Azure, paying twice for compute, storage, and data transfer. This often represents 20-30% incremental cost relative to single-cloud deployments.
- Inefficient data movement: Multi-cloud architectures frequently move data between clouds (incurring egress fees on one cloud and ingress storage on another). A company running analytics in one cloud and operational database in another might incur $500K+ annually just in data transfer fees.
- Invisible redundancy: Many companies implement automatic multi-cloud failover without realizing they’re maintaining active infrastructure on both platforms. The “backup” cloud sits at 30-40% capacity permanently, consuming resources but providing value only if the primary cloud fails.
For a company splitting workloads across multiple clouds, total infrastructure spending is typically 15-25% higher than single-cloud equivalent, with minimal additional benefit for most use cases.
The Financial Impact: How Cloud Costs Compress Margins
For SaaS companies, the impact of cloud cost inefficiencies flows directly to gross margin and exit valuation:
Typical Cloud Cost Structure for SaaS Companies
For a $50M ARR SaaS company with typical cloud infrastructure:
| Financial Metric | Amount |
|---|---|
| Annual Revenue | $50M |
| Cost of Revenue (all infrastructure + support) | $20M (40% CoR) |
| Cloud Infrastructure Spend | $10M (50% of CoR; 20% of revenue) |
| Gross Margin | $30M (60%) |
| Implied Cloud Cost per Customer | $10,000+ (if 5,000 customers) |
The challenge: most mature SaaS companies should achieve cloud infrastructure spend at $6-8M annually for the same workload and customer base. The additional $2-4M represents waste from over-provisioning, hidden fees, multi-cloud redundancy, and inefficient architectures.
The Margin Impact of Cloud Optimization
Capturing 50% of cloud waste ($1-2M annually) improves:
- Gross margin: From 60% to 62-64% (200-400 basis point improvement)
- Enterprise value: At 10x revenue multiple, $50M revenue company goes from $500M to $510-520M valuation (2-4% improvement). At typical 15x on high-margin SaaS, the uplift is $30-60M in value.
For PE firms, this represents either:
- Pre-close valuation benefit: Identifying and capturing cloud cost waste allows negotiation of lower purchase price (reflects lower cost of revenue than seller claimed)
- Post-close value creation: Implementing cloud optimization post-close flows directly to EBITDA and exit valuation
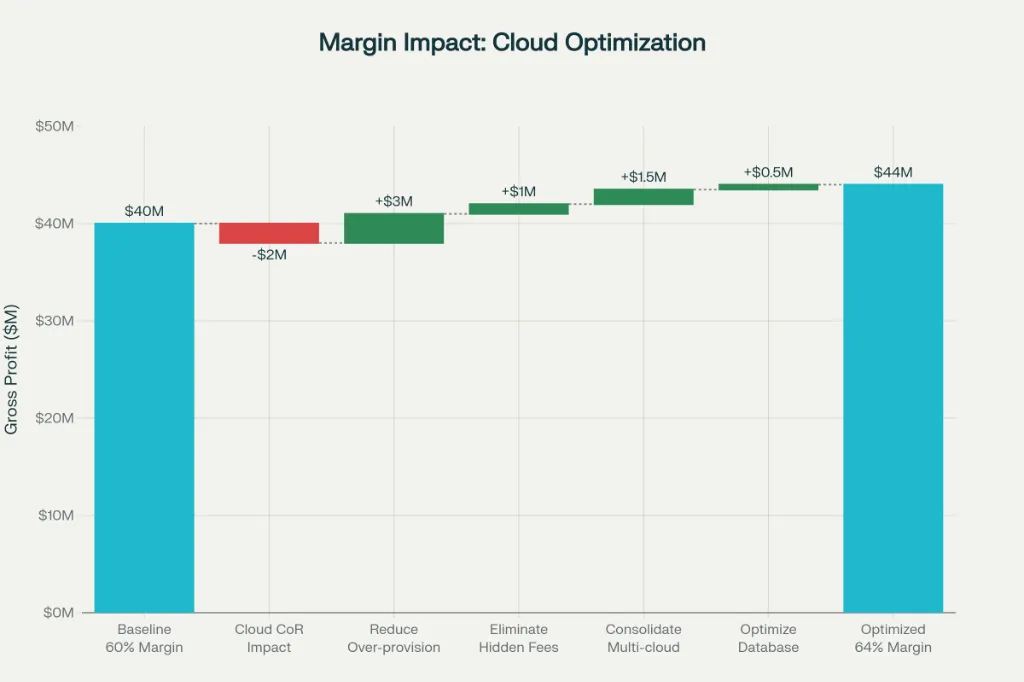
Real Example: $100M Revenue SaaS Company
- Pre-optimization:
- Revenue: $100M
- Cloud spending: $15M (15% of revenue; 50% of cost of revenue)
- Gross margin: 60% ($40M)
- Exit valuation at 12x: $480M
- Post-optimization (40% cloud cost reduction):
- Revenue: $100M (no change)
- Cloud spending: $9M (9% of revenue; 30% of cost of revenue)
- Gross margin: 64% ($44M)
- Exit valuation at 13x (multiple expansion for improved margins): $520M
- Value creation: $40M from pure cloud optimization
The Mechanisms: How Cloud Costs Balloon
Mechanism 1: Compute Over-Provisioning (40-50% waste common)
Typical scenario: A SaaS company provisions 100 compute instances for a “just in case” peak, but actual peak usage is 60-70 instances. The company pays for 30-40 instances that sit idle. At $0.15-$0.30 per instance per hour, this represents $10K-$40K monthly in wasted compute ($120K-$480K annually).
Over-provisioning occurs because:
- Teams fear performance issues more than cost overruns
- Actual usage patterns aren’t measured or understood
- Reserved instance decisions are made conservatively without data
- Auto-scaling isn’t configured to reduce costs during low-demand periods
Mechanism 2: Egress Fees and Data Transfer Charges (15-25% of cloud bills)
A video streaming SaaS company transfers 2 PB of video monthly out of AWS at $0.12 per GB:
- Monthly egress: 2,000 TB × $0.12 = $240K
- Annual egress: $2.88M
This company might have sized its cloud budget at $15M annually and discovered too late that 19% of that budget is egress fees that weren’t obvious during planning phases.
Mechanism 3: Multi-Cloud Redundancy Without Optimization (15-25% cost premium)
A company runs primary workloads on AWS and maintains hot backup on Azure for disaster recovery:
- AWS spend: $8M annually (primary)
- Azure spend: $2M annually (backup; 25% of primary because not all workloads are replicated)
- Total: $10M
Optimized approach (active-active with regional failover):
- AWS spend: $6M (rightsize compute)
- Azure spend: $0.5M (for specific workloads better suited for Azure)
- Total: $6.5M
- Savings: $3.5M (35% reduction)
Mechanism 4: Storage and Database Inefficiency
Legacy data warehouses in cloud, consuming expensive storage without optimization:
- Company runs uncompressed data in hot storage (immediately accessible, highest cost)
- Data is years old, rarely accessed, yet maintained in hot tier
- Moving to cold storage (lower access tier) would reduce costs 70-80%
Typical finding: A company storing 500 TB of data in hot storage at $0.02/GB-month:
- Hot storage cost: 500,000 GB × $0.02 = $10K monthly = $120K annually
- Cold storage cost: 500,000 GB × $0.004 = $2K monthly = $24K annually
- Wasted spend: $96K annually
Mechanism 5: Abandoned or Low-Utilization Services
Cloud providers offer numerous specialized services. Companies provision them for specific use cases that later change or get abandoned:
- A company provisions 10 RDS database instances for a project. Project is cancelled or consolidated. Instances continue running, billed monthly, until someone notices 6-12 months later.
- Machine learning pipelines provisioned for testing; left running with minimal activity
- Development/testing environments configured for production load even though actual testing uses fraction of capacity
Typical finding: A company discovers $500K annually in running but unused services across various parts of the infrastructure.
The Path to Optimization: Cloud Cost Reduction Playbook
Phase 1: Audit and Assessment (Week 1-3)
- Activities:
- Export 12 months of cloud billing data from all providers
- Assess cost drivers: compute, storage, egress, licensing, specialized services
- Identify top 10-20 cost centers (80/20 principle: 80% of costs from 20% of services)
- Estimate over-provisioning, hidden fees, and multi-cloud redundancy
- Output: Baseline cloud spending; identified optimization opportunities ($500K-$5M for typical mid-market SaaS)
- Key finding: Most companies discover 15-30% of cloud spending is obvious waste (abandoned services, egress fees, unused reserved instances)
Phase 2: Quick Wins (Week 3-6)
- Activities:
- Decommission abandoned or unused services ($50K-$300K savings)
- Eliminate egress fees through architectural changes ($100K-$500K savings)
- Adjust storage tiers to reduce data retrieval costs ($50K-$200K savings)
- Optimize reserved instance purchases ($100K-$400K savings)
- Output: 15-25% immediate cloud cost reduction with minimal engineering effort; $200K-$1.5M annual savings
- Timeline: 4-8 weeks
Phase 3: Strategic Optimization (Week 6-12)
- Activities:
- Rightsize compute instances to actual usage patterns ($200K-$800K savings)
- Consolidate multi-cloud redundancy if applicable ($300K-$1M savings)
- Implement auto-scaling and dynamic compute scheduling ($150K-$500K savings)
- Optimize database configurations and query patterns ($100K-$300K savings)
- Output: Additional 15-20% cloud cost reduction; total 30-45% savings
- Timeline: 8-16 weeks
Phase 4: Cloud Repatriation (Strategic Decision)
For companies spending $5M+ annually on cloud, consider whether repatriation to private infrastructure makes financial sense:
- Repatriation economics:
- Private infrastructure build-out: $3M-$10M one-time
- Annual private infrastructure cost: $1M-$3M (vs. $5M-$15M cloud)
- Payback: 2-4 years
- Long-term savings: 40-60% reduction in infrastructure spend
- Dropbox repatriation example:
- 90% of data moved from AWS to proprietary infrastructure
- Savings: $74.6M over 2 years
- Gross margins improved: 33% → 67%
- Strategic advantage: ability to offer lower pricing, higher profitability, or accelerated growth
When repatriation makes sense:
- Annual cloud spend: $5M+
- Workload characteristics: predictable, not requiring extreme elasticity
- Data scale: 100+ TB
- Company maturity: profitable or near-profitable (stable workloads)
When cloud remains optimal:
- Unpredictable workloads requiring elasticity
- Startup phase with rapidly changing infrastructure needs
- Specialized services (machine learning, analytics) better provided by cloud vendors
- Geographic distribution requiring global presence
Structuring Deals for Cloud Cost Value Creation
Pre-Close Due Diligence: Cloud Infrastructure Assessment
Standard technology due diligence should include cloud cost analysis:
- Cloud spend analysis: 12-month historical cloud bills across all providers
- Cost driver breakdown: Identify top 10 cost drivers and % of total spend
- Egress fee assessment: Quantify data transfer charges as % of total spend
- Multi-cloud assessment: Identify workloads on each cloud; assess for redundancy
- Over-provisioning analysis: Estimate % of compute sitting idle
- Optimization opportunity identification: Conservative estimate of 20-40% cost reduction
- Timeline: 2-3 weeks; $15K-$30K cost
- Output: Cloud cost optimization opportunity quantification; incorporation into purchase price and deal structure
Adjusting Deal Valuation for Cloud Cost Waste
If cloud cost waste is identified:
- Option 1: Reduce purchase price
- Identified waste: $2M annually in over-provisioning and hidden fees
- Assume 70% capture probability × $2M = $1.4M annual benefit
- At 10x multiple on cost savings: reduce purchase price $14M
- Option 2: Use cloud cost reduction as earnout lever
- Baseline cloud spend as of close: $10M annually
- Earnout target: reduce to $8M annually (20% reduction)
- Earnout tied to achievement: if seller stays through cloud optimization, receives earnout tied to savings captured
- Option 3: Establish post-close optimization reserve
- Reserve $500K-$2M for cloud optimization consulting and engineering
- Fund cloud cost reduction initiatives immediately post-close
- Ensure optimization happens quickly rather than deferring to Year 2
Post-Close Execution: 100-Day Cloud Optimization Plan
Month 1: Assessment and Quick Wins
- Complete cloud cost audit (top 20 cost drivers)
- Identify and decommission unused services ($100K-$300K savings)
- Optimize reserved instance purchases ($100K-$300K savings)
- Target: 10-15% cost reduction; $500K-$1M annual savings
Month 2-3: Strategic Optimization
- Rightsize compute instances and eliminate over-provisioning ($200K-$600K savings)
- Reduce egress fees through architectural changes ($150K-$400K savings)
- Consolidate multi-cloud redundancy if applicable ($200K-$500K savings)
- Target: Additional 15-20% cost reduction; total 25-35% savings; $1.5M-$2.5M annual
Month 3+: Governance and Ongoing Optimization
- Implement cloud cost monitoring and governance
- Establish FinOps practices; monthly cost reviews
- Evaluate cloud repatriation for strategic workloads if applicable
- Build accountability into engineering team goals
Case Studies: Real-World Cloud Cost Optimization
Case Study 1: Cloud Repatriation
Dropbox:
- Pre-optimization: 90% of data in AWS; $1B+ annual cloud costs
- Optimization: Moved 90% of data to proprietary data centers
- Results: $74.6M savings over 2 years; gross margins increased from 33% to 67%
Case Study 2: Cloud Cost Reduction (Optimization, Not Repatriation)
37signals/Basecamp:
- Pre-optimization: $3.2M annual cloud costs on AWS
- Optimization: Rightsized compute, eliminated over-provisioning, optimized databases
- Results: Reduced to $1.3M annually; $10M+ savings over 5-year projection
Case Study 3: Multi-Cloud Consolidation
Financial services SaaS company:
- Pre-optimization:
- AWS: $8M annually (primary)
- Azure: $2M annually (redundancy)
- Total: $10M
- Optimization: Consolidated to AWS; implemented auto-scaling
- Results: Reduced to $6.5M annually; $3.5M savings (35% reduction)
Recommendations for PE Firms
-
Make Cloud Cost Analysis Mandatory in Tech Diligence Add cloud infrastructure assessment to standard technology due diligence checklist for all SaaS, cloud-native, and technology-intensive acquisitions. Budget 2-3 weeks and $20K-$40K for comprehensive assessment.
-
Hire or Retain Cloud Infrastructure Experts Develop internal cloud cost optimization capability or establish retainer relationship with cloud infrastructure firms. This enables systematic optimization across portfolio.
-
Implement FinOps Practices Portfolio-Wide Establish cloud cost governance practices across portfolio companies:
- Monthly cloud cost reviews and variance analysis
- Quarterly cloud optimization assessments
- Annual cloud provider contract renegotiations
-
Establish Cloud Cost KPIs in Portfolio Monitoring Track:
- Cloud spending as % of revenue (target: 10-15% for typical SaaS)
- Cloud spending as % of cost of revenue (target: 30-40%)
- Compute utilization rate (target: >70%)
- Egress fees as % of total spend (target: <10%)
-
Evaluate Cloud Repatriation for Strategic Portfolio Companies For companies spending $5M+ annually on cloud, evaluate whether cloud repatriation makes economic sense. Many PE firms are systematically moving portfolio companies from public to private cloud, capturing 30-50% cost reductions.
-
Leverage Portfolio-Wide Cloud Purchasing Power Aggregate cloud contracts across portfolio to negotiate volume discounts with AWS, Azure, and Google Cloud. Even 5-10% discounts across multiple portfolio companies represent $500K-$2M in annual savings.
Conclusion: Cloud Infrastructure as Strategic Value Lever
Cloud cost fragmentation and over-provisioning represent one of the most consistent and immediate value creation opportunities in PE acquisitions. The 50% cloud-to-revenue ratio for SaaS companies isn’t a given; it’s a symptom of suboptimal architecture and cost governance that PE firms can systematically address.
PE firms that systematically assess cloud costs during diligence, adjust deal economics for identified waste, and execute post-close optimization plans will capture 20-50% cloud cost reductions that flow directly to EBITDA and exit valuations. For a typical PE-backed SaaS company, this represents $1-5M in annual EBITDA improvement—equivalent to a 1-3x multiple expansion on exit valuation.
The competitive firms will treat cloud infrastructure optimization not as a technical concern for IT teams but as a financial engineering priority at par with traditional PE value creation levers like revenue growth and margin expansion. Cloud cost optimization may be the single highest-ROI value creation opportunity PE firms aren’t systematically capturing.
References and Source Data
- OpenMetal, FastFinOps, OpenMetal blog 2025; public cloud costs reach 50%+ of SaaS cost of revenue; Andreessen Horowitz reports $100B market value loss from cloud impact on margins
- Typical SaaS cost structure: cloud infrastructure is 30-50% of cost of revenue; full cost of revenue includes hosting (30-50%), support (15-25%), and other (10-25%)
- Standard SaaS valuation multiples: 10x revenue for 60% margins; 7x revenue for 50% margins; 5x revenue for 40% margins; multi-cloud analysis shows 15-25% cost increase relative to single cloud
- Dropbox: $74.6M saved over 2 years moving 90% of data from AWS to proprietary infrastructure; gross margin improvement from 33% to 67% (Wall Street Journal 2024, LoadTalk 2025)
- Flexera FinOps research 2024-2025; typical cloud resource utilization 30-40% of allocated capacity; 28-44% of cloud budgets wasted annually
- Splunk Cloud Cost Management; egress fees 15-25% of total cloud bills for typical SaaS; data retrieval and cross-region transfer costs frequently overlooked
- Multi-cloud cost analysis; 15-25% cost premium for multi-cloud vs. single cloud due to redundancy and management overhead
- Additional sources: Flexera 2025 Cloud Spend Report (84% exceed budgets, 70% use hybrid cloud); IDC CloudOps Survey 2024 (70% of G1000 investing in FinOps); FinOps Foundation research; McKinsey $3 trillion cloud optimization opportunity; Vista Equity Partners cloud optimization practices (50-60% cost reductions); 37signals Basecamp cloud cost reduction case study; Crayon FinOps best practices 2025